Sidebar Navigationv

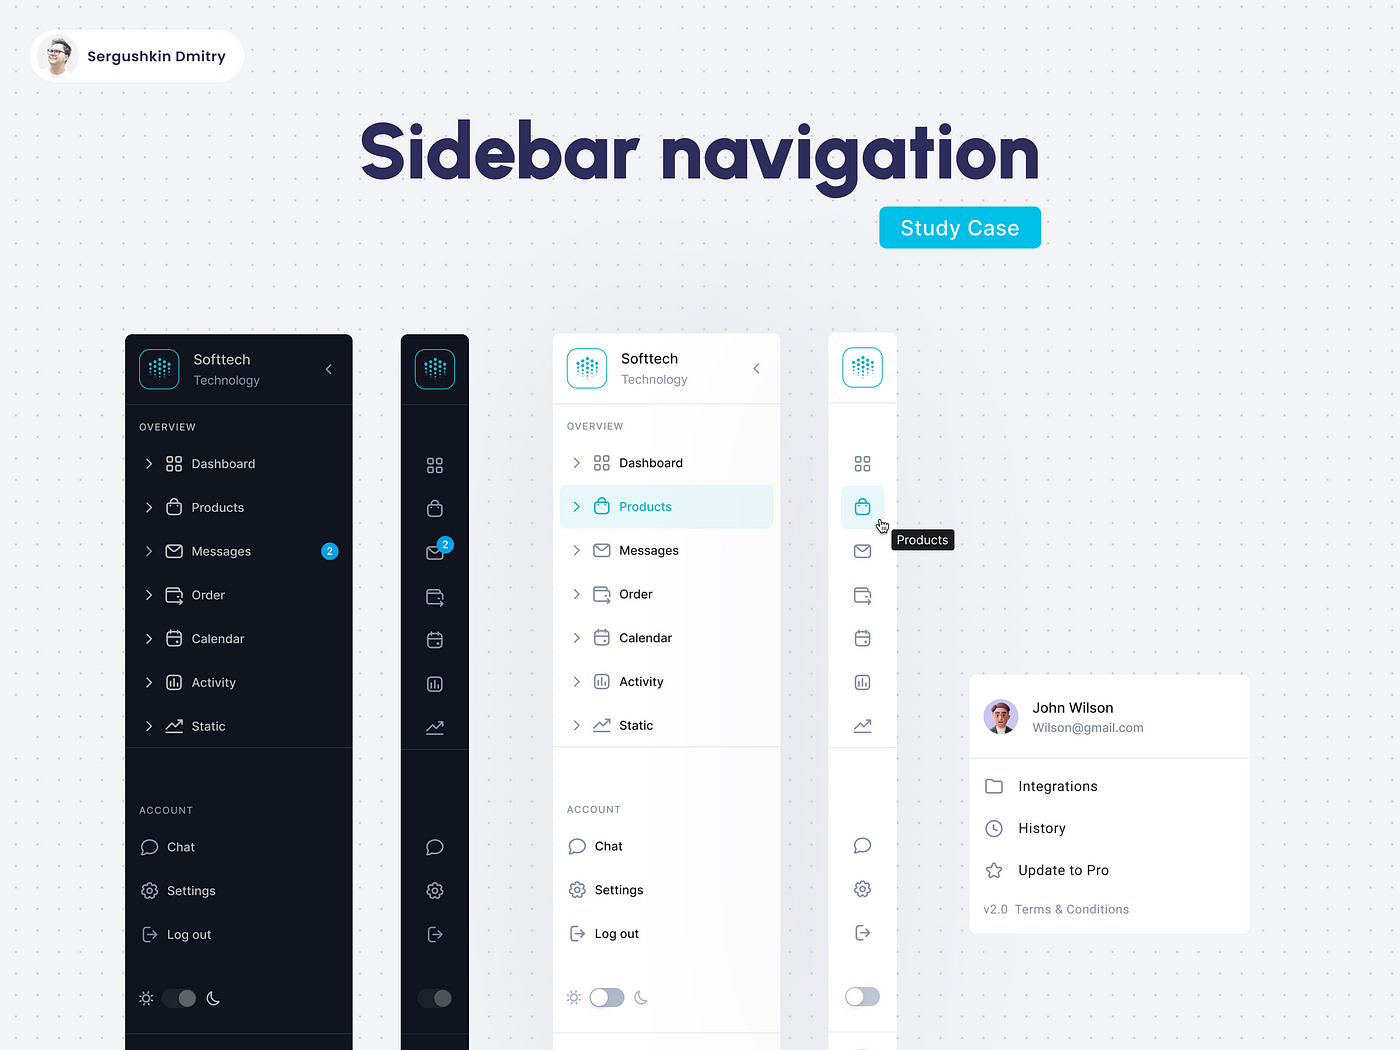
Case study research: Sidebar Navigation

Overview

Sidebar navigations are rapidly becoming more popular (especially with SaaS products) thanks to the way that they enable designers to utilize layout space better. Navigation menus are vital to user experience and interface design. Most benefits of this navigation UI derive from its ability to accommodate many top-tier categories.

Purpose

Creating a clean and … Read the rest

Usable Data table in Applications

  • Best Practices for Usable and Efficient Data table in Applications
  • Tips and Insights to Create Intuitive, User-Centered Data Tables

Data tables provide a structured way to organize and manage information, making it easier to analyze and visualize data effectively. Well-designed tables enable users to access, analyze, and act on critical information quickly and accurately. However, creating effective data tables is … Read the rest

UX metrics alignment


UX metrics should be aligned with engineering metrics to demonstrate the tangible impact of user experience improvements on product performance and business goals, creating a unified view of success and fostering better cross-functional collaboration and trust.

By connecting metrics like task success rate and NPS with engineering outcomes such as error rates and performance, organizations can ensure that design decisions … Read the rest

UX Design Activities Within the SDLC Phases

UX design activities span all phases of the SDLC, from initial Planning (user research, defining scope) to Requirements Analysis (understanding user needs, creating personas) and Design (wireframing, prototyping, usability testing). In the Development (Implementation) phase, UX ensures adherence to design, and it continues through Testing (evaluating user experience and usability), Deployment, and Maintenance (continuous improvement and user feedback).

Here’s Read the rest

User journey maps

User journey maps are an effective way to visualize user’s experience for the entire team. Instead of pointing to documents scattered across remote fringes of Sharepoint, we bring key insights together — in one single place. The downside is that journey maps are often too linear, too predictable, too neat — which is often exactly the opposite of what users … Read the rest

UX metrics – Psychological


These metrics measure how users feel, think, and behave. They have 5 main categories:

💎 Emotional metrics
💎 Behavioral metrics
💎 Perception metrics
💎 Satisfaction metrics
💎 Cognitive load metrics

These metrics are typically collected through post-task or post-session questionnaires and can reveal how mentally demanding or emotionally satisfying the experience was.

Which metrics do you measure more often? For … Read the rest

Measure Content In UX

How To Test And Measure Content In UX?

The goal of the content design is to reduce confusion and improve clarity. Yet often it’s difficult to pin point a problem as user feedback tends to be not specific enough. But: we can use a few simple techniques to assess how users understand and perceive content. Let’s take a look.

Quick … Read the rest

Service blueprint | Figma

A service blueprint is an excellent tool for designing a service in its entirety.

Centered around the customer journey, a service blueprint defines how an organization’s capabilities (people, policies, processes, and systems) enable the customer’s experience. With this holistic perspective on the entire service, it’s easier to see where there is tension between the customer experience and the organization’s capabilities.… Read the rest

UX impact Measuring  challenging,

Measuring UX impact is already challenging, but in Enterprise UX it can be even harder.

Design without metrics is basically arts & crafts at work


When you’re working on employee tools, there’s often no A/B testing, no NPS scores, and no real “conversion events.” Success can look like a planner catching an error before it disrupts operations, or a technician … Read the rest

Measure And Show UX Impact

Great UX goes unnoticed simply because we don’t speak the language of business. Time to turn intuition into measurable value

How To Measure And Show UX Impact. With practical guidelines on how to track and articulate business impact of design work ↓


To visualize UX impact, we often use design KPI trees or design KPI graphs (see above). Both are … Read the rest